status report

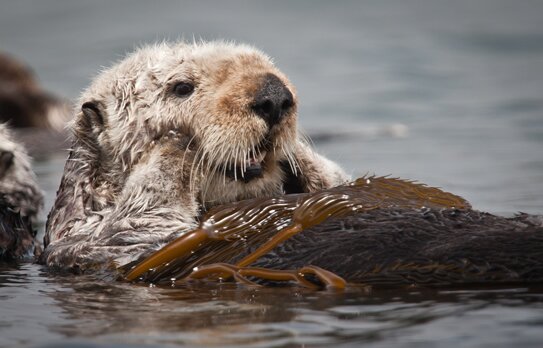
Photo by Mike Baird
The Otter Project produces an annual southern sea otter status report to characterize the current status of the population. This is a challenging task due to year to year environmental variability and other external factors that may provide conflicting information. By analyzing annual survey data, we can assess the health and trends of the sea otter population and determine a proper course of action for improved management.
The following reports are prepared using public agency and peer reviewed data. Surveys are conducted by researchers from various organizations and coordinated by the U.S. Geological Survey Western Ecological Research Center (WERC). Stranding numbers are provided by the Sea Otter Stranding Network, a coalition of agencies and organizations, including Department of Fish and Game, U.S. Geological Survey, Monterey Bay Aquarium, California Academy of Sciences, Santa Barbara Museum of Natural History. Survey data is made publicly available on the USGS website. All agency information is available for public use.
In mid-September the US Geological Survey and US Fish and Wildlife Service released the results of the Spring 2015 Sea Otter Census. The range-wide total number of otters counted increased sharply from 2947 counted in 2014 to 3254 counted in 2015. Any count of wildlife is imprecise and the agencies use a three-year running average to smooth out the bumps and dips; the average increased from 2944 to 3054.
Note: The Spring Survey 3–year running average is the metric the U.S. Fish and Wildlife Service’s Southern Sea Otter Recovery Plan recommends using to assess the sea otter population status, thus reducing the influence of anomalously high or low counts from any particular year (USFWS, 2003).
Three years of record pupping has supported the population growth. For the decade 2003 thru 2012 the spring pup counts (mainland only) roller-coastered in a range between 235 and 391 followed by pup counts of 455, 469, and 505 in 2013, 2014, and 2015 respectively. Again, raw counts of wildlife are imprecise and the three-year running average of 323 spring pups in 2012 compares to an average of 476 in 2015.
The number of dead sea otters found on the beach (dead-strandings) continues to increase both in number and as a percentage of the population found dead, a worrying sign. The number of dead-strandings in 2014 (386) was the highest on record. One would expect the number of dead to increase proportional to the population, but as a percentage of the population 2014 was sadly a record year at 13.4 percent. Through the 1990s the percentage generally ranged in the mid-single digits. The high pup count, averaging around 19-percent for the past three years, may have outpaced the higher mortality.
The northernmost otter spotted was just north of Año Nuevo Island, north of Santa Cruz and south of San Francisco. The southernmost otter spotted was near Gaviota State Beach, northwest of Santa Barbara. Officially, the range was essentially unchanged. Unofficially, The Otter Project continues to receive reliable reports (including pictures) of sea otters as far north as Mendocino and as far south as Santa Barbara and Orange County. We remain optimistic that the population will expand its range soon; range expansion is essential to population recovery.


Facebook Wordpress Twitteryoutubemeet